I. INTRODUCTION
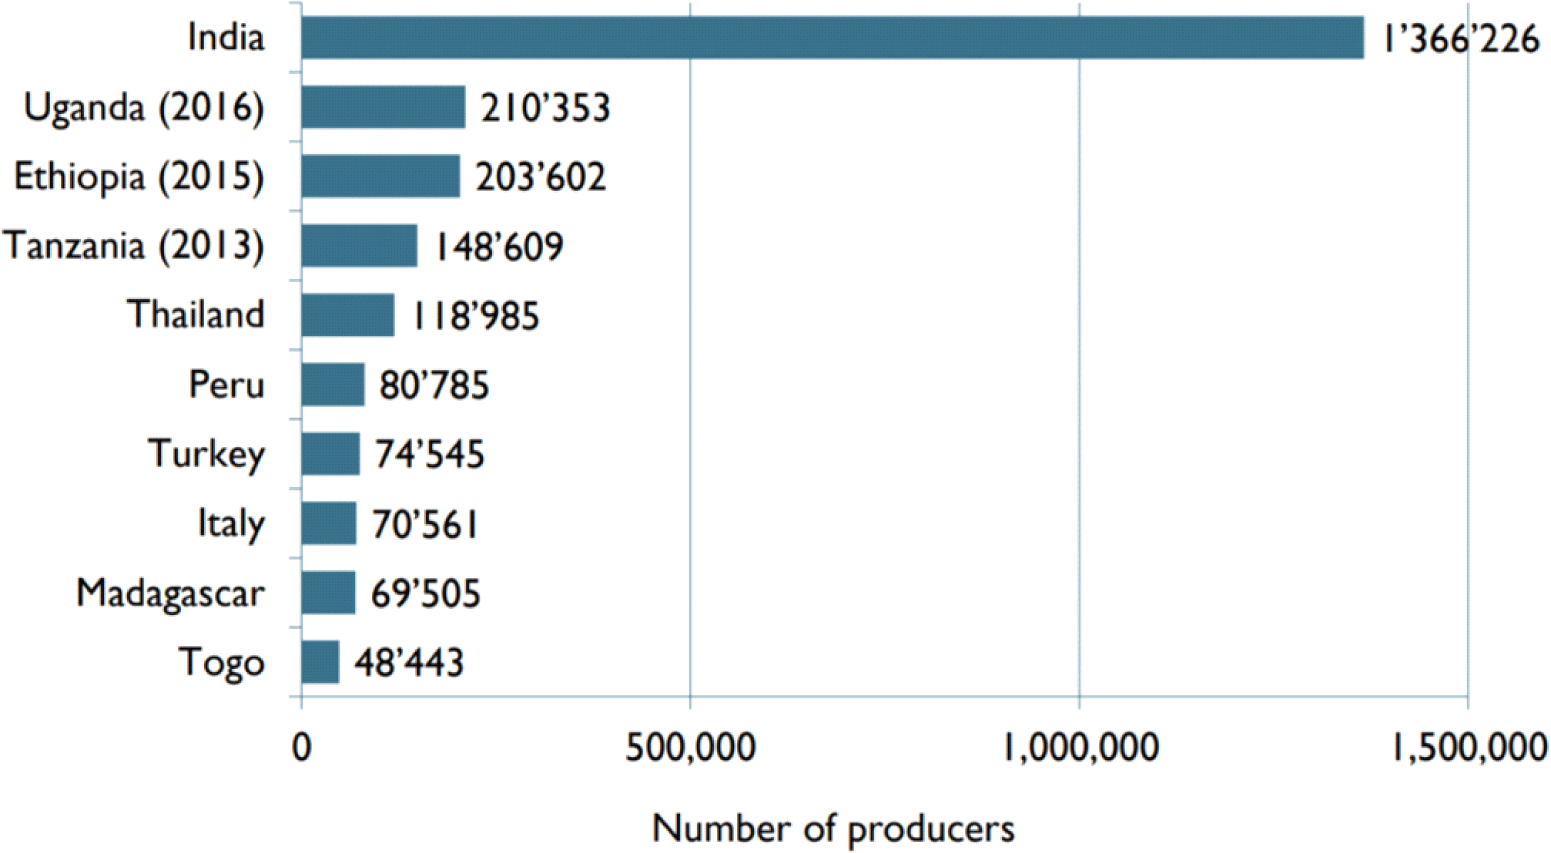
Uganda has the second largest number of organic producers1) all over the world after India (<Figure 1>). Their organic agriculture area is 185,598 hectares, which is 1.3% of total agriculture area (Willer et al., 2021). The growth of organic agriculture in Uganda has been attributed to a few large cooperatives and NGOs strongly promoting organic agriculture, and considerable progress in developing domestic standards and certification bodies (Walaga, 2005).2)
Following the trend, the Ugandan government has released “Draft of Uganda Organic Agriculture Policy”3) in 2009 and finally launched the “National Organic Agriculture Policy (NOAP) in September 2020. It has taken more than a decade until launching the policy after releasing its draft document presumably attributed to the fact that the government was skeptical of organic agriculture until they have seen its positive results (Wynen & Vanzetti, 2002). This is because of relatively low productivity of organic farming which is the world on-going controversial issue and also internal conflicting interests e.g., a government organization, Cotton Development Organization makes some profits from pesticides sale (Chell, 2013). Nonetheless, there have been many requests and a big need to support the development of organic agriculture. The long-awaited supporting policy, NOAP however still has room for improvement to be effectively implemented.
In Uganda, 95% of all farmers are composed of smallholders (Adebiyi, 2014),4) and among organic farmers as an estimate, non-certified farmers who don’t have organic certification are three times more than certified ones (Walaga, 2005). These non-certified farmers have not got the certification mainly due to the high costs of certification program. Some of them have other reasons e.g., it requires loads of paperwork while they have lack of literacy or their products are originally not aiming at external markets which have lots of requirements such as the scale and standards in aspects of homogeneity, packaging, sustained production over the year, etc (Cáceres, 2005). But these reasons are still to an extent linked to their financial status. Consequently, they cannot get the premium price that is varying from 20% to 300% of conventional products price (Taylor, 2006), although their produces meet the required standards of organic methods.
Nevertheless, these non-certified organic farmers are still using organic farming system without receiving organic prices. This is mostly because they can hardly afford chemical pesticides or fertilizers. They only use traditional means since they are not aware of organic approaches nor accessible to training of basic organic practices to improve the productivity and profitability of their farms, and are called as ‘by-default’ organic farmers (IFOAM, 2013).
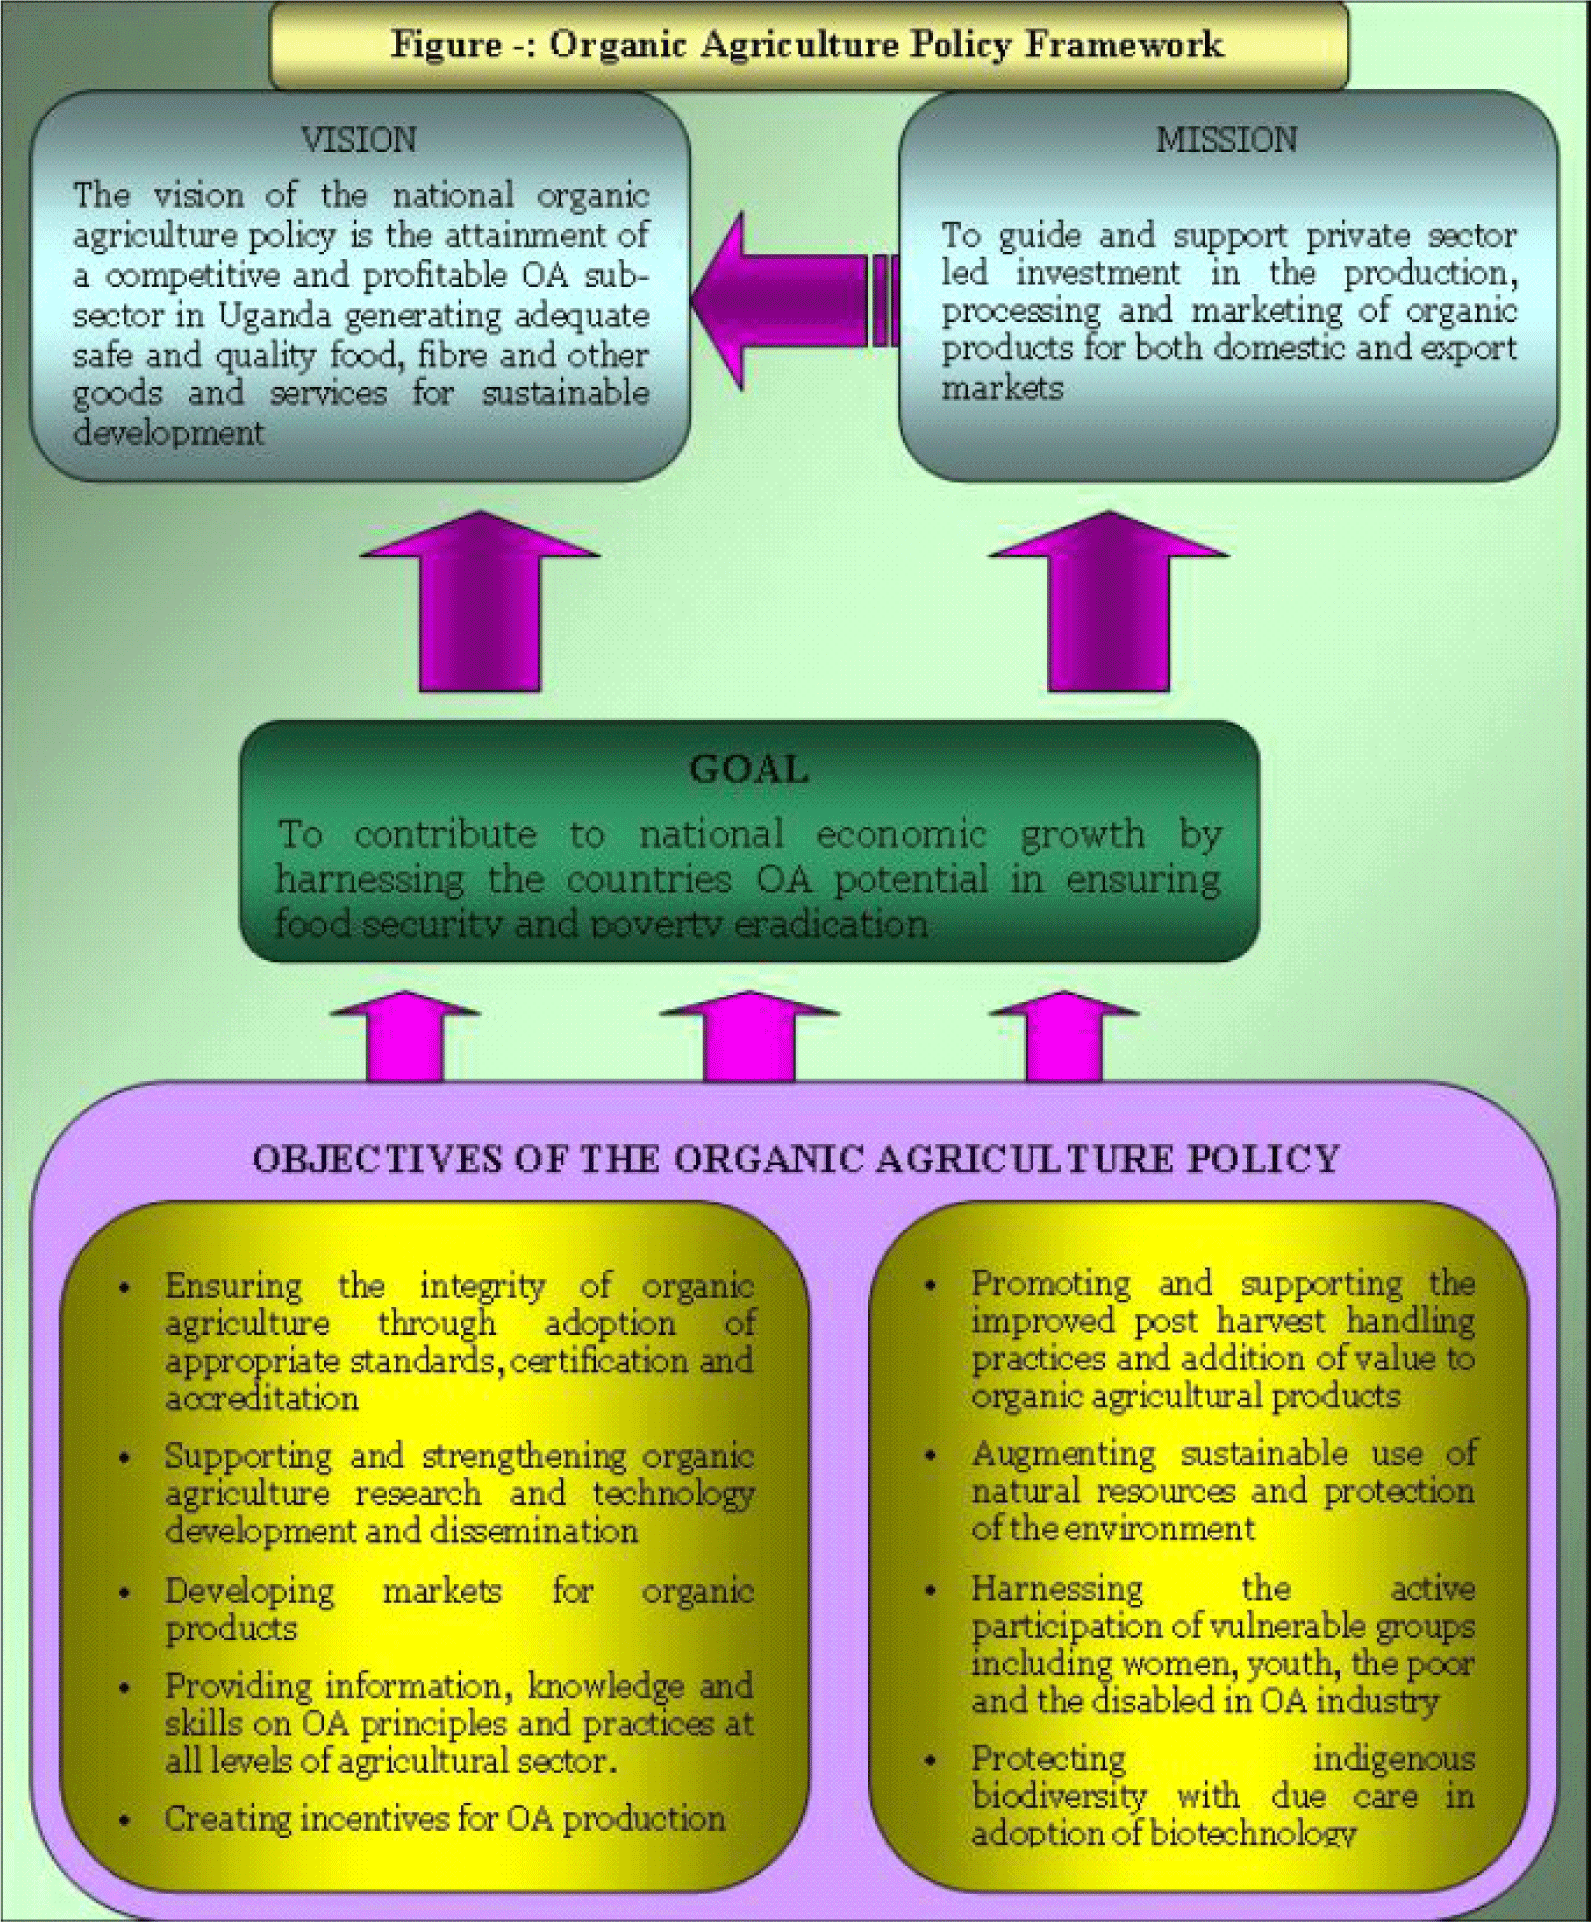
Meanwhile, one of the objectives of NOAP is “to ensure the credibility of organic agriculture through adoption of appropriate standards, certification and accreditation”. To achieve this objective, NOAP have several broad strategies such as promoting awareness on certification system and supporting enforcement of certification.
This paper assumes that the Ugandan government would further develop the NOAP (in this paper considered as organic agriculture “certification support policy” for its urgency) since the policy has not been long since launched so that its impacts/results are unknown and also its document still needs more detailed implementing strategies based on economic analysis. The goals of this analysis paper are therefore (1) to anticipate how supply quantity would change after implementing the policy on the farm-level and (2) to compare the welfare change with and without the certification support policy by estimating its potential economic impact on welfare of producers and consumers in the Ugandan organic market and the government. With the results providing rationales and direction on strategies for certification, it would also identify other factors or external effects influencing the welfare and discuss policy implication.
II. POLICY DESCRIPTION
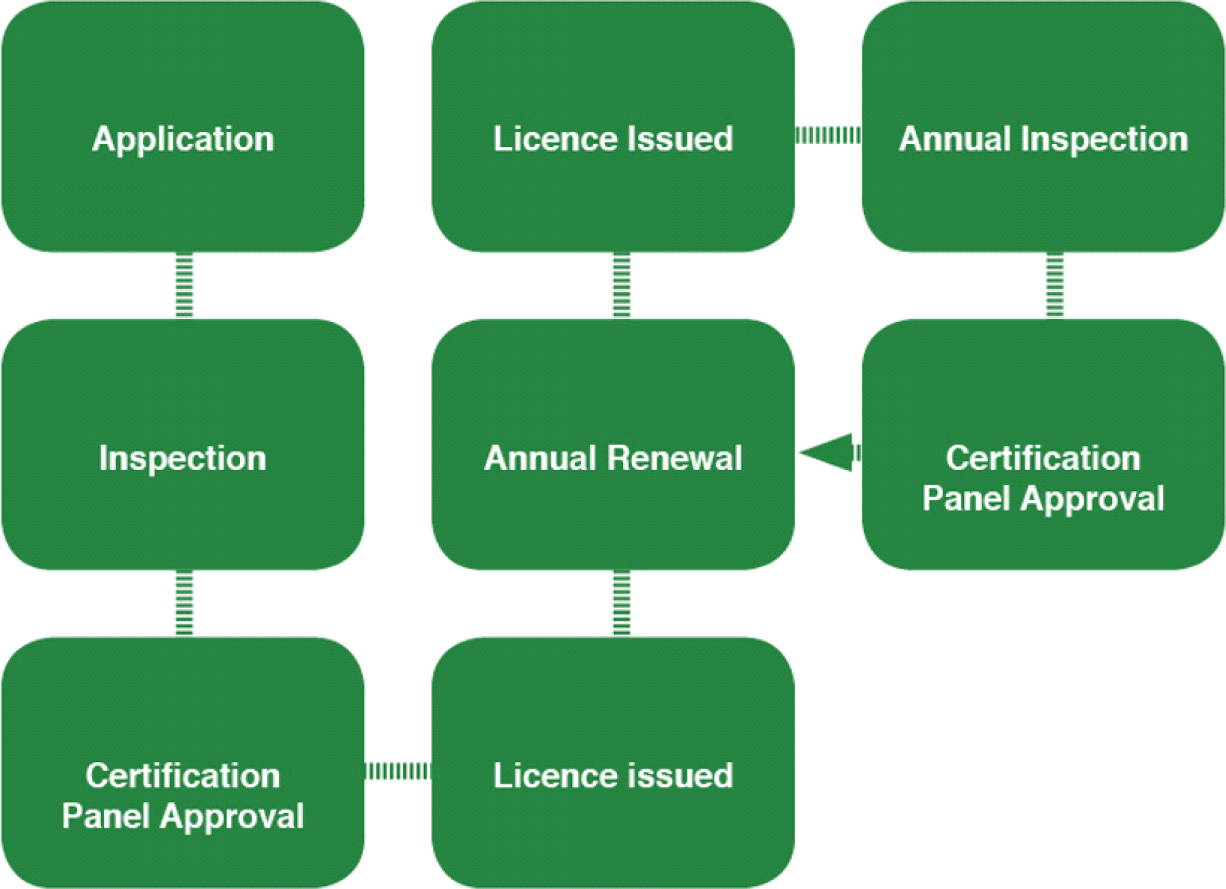
Organic certification ensures that the farming process follows the requirements of the standard for organic agriculture. The costs vary on the size of operation and by the certification agency. The certification program includes investigation, administration, travel expenses. After the first investigation, it is reinvestigated on a regular basis and farmers have to pay for it annually (See <Appendix Figure 1>) Then, a certificate is issued every year following the successful inspection (René & Els, 2004). This certificate is essential for organic products sales since consumers of organic produce rely on the organic certification proving whether or not the products are literally organic (Tumushabe et al., 2007).
Besides on individual certification which is one certification issued for one farm, there are other types of certification. Another one is Smallholder Group Certification (SGC) system. In SGC system, smallholders can form a group with similar organic farming practices (Adebiyi, 2014) i.e., homogeneity of products, location and production system, and apply only one certification as one operator. The group must be large enough to maintain an “Internal Control System” to manage the group, minimum of about 30 farmers (Tumushabe et al., 2007). Then, certification agency investigates a few spots instead of all of the farms belonging to the group, then the costs will be shared. This system lightens the burden of farmers by reducing the effort and the fee of certification assigned to each farm.
The other certification system is Participatory Guarantee Systems (PGS). IFOAM defines PGS as “locally focused quality assurance systems that certify producers based on active participation of stakeholders and are built on a foundation of trust, social networks and knowledge exchange”. This system works in the local market so that it is suitable for those who are aiming at local sales.
There are two main ways of certification support policy. One is establishing organic certification programs by the government and offering it on a no-cost or low-cost basis to farmers (POETCom, 2016). The provision of subsidies for certification is the other one. For this subsidy, the government covers certification costs and the form of the support can vary (POETCom, 2016). For instance, they can decide to cover it fully or partly and to put the limited period on it or not.
The former type is more likely to distort certification market which has different preference of certification agency by farmers. The latter one, certification subsidy policy is used for this analysis, since this is the dominant way on the globe5) and usually, the governments set the maximum amount of subsidy e.g., max. $3,000 per farmer.
As a strategy of organic agriculture policy, the governments adopt the certification support policy in order to ensure equal access of all operators to the domestic and the international markets, to increase their profits and also to encourage and support conversion of conventional farmers into organic farming.
III. THEORETICAL ANALYSIS
In general, developing countries rarely have a proper local market for organic products due to low purchasing power of the local people and insufficient marketing efforts. Thus, export is the major sales strategy for most of organic producers in developing countries, given the small size of local markets (Scialabba & Hattam, 2002). With the same reason, Uganda has a small domestic market, so their organic products are export-oriented for the demand dominantly from western markets.6) For example, the domestic market in Uganda for organic food stood at around $700,000 in 2008, which just reached about 2% of the total organic export value (Willer & Lukas, 2010).
Meanwhile, the small exporting country can’t influence the global market due to the relatively small supply, which means the import demand that a small exporting country faces in the international market is perfectly elastic, then the country is a price taker (Koo & Lynn Kennedy, 2008) (See <Figure 2>). As such, although Uganda is globally the second largest country in organic markets in terms of the number of producers, its production quantity is not significant enough to affect the world market and the world price.7)
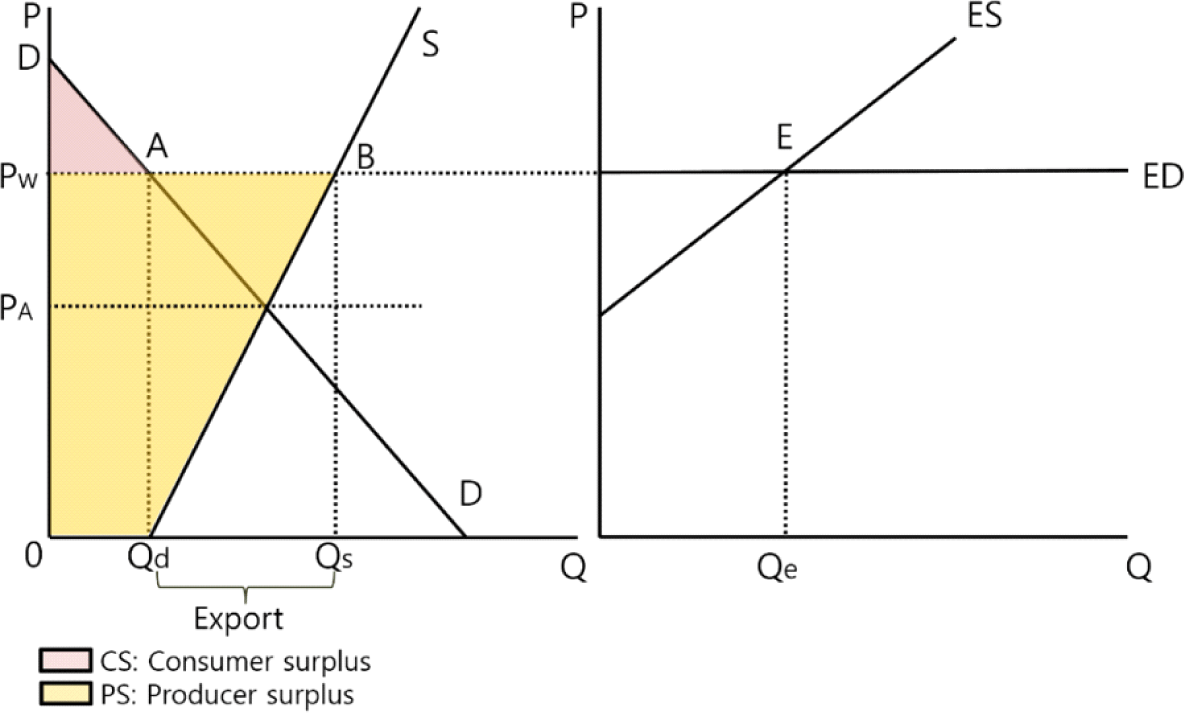
As <Figure 2> indicates, in a closed state, the equilibrium autarky price (PA) is the price which matches domestic market supply with domestic market demand. Whereas, if the international price (Pw) which is determined by global import demand (ED) is higher than the autarky price, then the country will export the good in an open-economy as determined as ES curve in the right graph (Suranovic, 2012). In a same line, if the international price is lower than the autarky price, the country will import the product (Suranovic, 2012).
Supply curve (S) is calibrated as follows:
* b = ε Q ÷ P
(ε: elasticity of supply)
In the Ugandan domestic organic market, there has been excess supply because of the lack of demand. Meanwhile, supply has been continued to grow as certified products increase every year,8) and it has generated even more excess supply going to the international market. <Figure 1> represents demand and supply in Uganda domestic organic market (left side) and the international organic market (right side). The difference between domestic supply quantity (Qs) and domestic demand quantity (Qd) which is excess supply in the local market, is what they are exporting (Qe) in the global market. This is the situation before implementing certification subsidy policy, and consumer surplus (CS) is the area of DPwA and PwBQd0 is producer surplus (PS).
After adopting the certification subsidy policy, in supply side, farmers will increase production since subsidy reduces production costs and also there will be more participants who were originally either non-certified farmers or conventional farmers. Therefore, there will be supply increase while demand won’t be changed.
<Figure 3> represents after-policy situation. Since certification costs are applied according to the size of farm operation, subsidy is calculated per yield of kg in this graph, which means marginal cost decreases by subsidy. Then, supply curve shifts to the right (S’) in parallel as subsidy, yet the price (Pw) is not changed as Uganda is small country whose organic production doesn’t affect global market as explained above. It makes a change of welfare. PS increases by the area of BCFQd while CS remains the same. Government surplus (GS) is negative value because government expenditure is generated, which is area of PwCEA, as all of new supply quantity (Qs’) should be covered as the subsidy object. Since CS remains the same, total welfare change is determined by the change of PS and GS. When PS change is larger than GS change in the absolute term, there is welfare gain, and vice versa. As a result, in the subsidy case, there is a welfare loss when the government provides it.
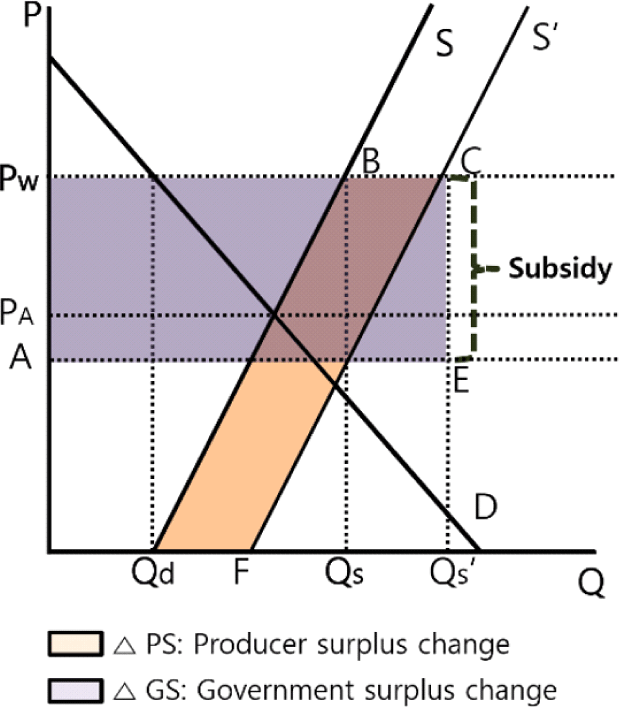
PS change and GS change are calibrated by following equations:
(s: subsidy per unit)
Certification subsidy causes a change of welfare in the conventional market as well. Its supply would decrease since some of the conventional farmers will decide to convert and some of the non-certified producers will leave for the organic market. In this case, supply curve moves to the other way around i.e. to the left. CS would decrease, whereas the change of PS would not be clear. Accordingly, total welfare change is the sum of the change of consumer and PS, because there is nothing changed in the government side for this market. Yet more details are not described here, as the main object of this analysis is organic market.
IV. QUANTIFICATION
As the example to quantify the theory, organic coffee is used, since it is one of the main crops produced and exported by Ugandan organic farms, especially for smallholders.9) For example, the leading export products of Uganda by value, ranked in order of importance in 2004-05, were coffee, cotton, fresh and dried fruit and vegetables and sesame (each contributing at least US$ 1 million) (Tumushabe et al., 2007).
For quantification, there are 3 scenarios. The first scenario (S1) is providing a subsidy covering 50% of the certification costs, the second one (S2) is covering 70% and 100% is the last one (S3). And this subsidy would support each year all of those who were already doing organic farming regardless of whether it was certified or not and also those who have converted to organic agriculture, which means all farmers using organic process at that moment.
All required data are described in Table 1. Here are some assumptions. First, it is assumed that all of the production quantity is sold without leaving any stock. For the price, average price of two types of coffee is used and 20% of premium is average percentage for premium price of organic coffee. World price and subsidy are calibrated by following equations:11)
| Item | Value |
|---|---|
| Production quantity | 2,300 tons (Potts et al., 2014) |
| Land size | 4,500 ha (Potts et al., 2014) |
| World price (per kg) | $5.034 |
| Subsidy (per kg) | $0.17(S1); $0.24(S2); $0.35(S2) |
| Supply elasticity | 0.2 (Hoyt & McMillan, 2004) |
| Premium percentage | 20% (CBI, 2014) |
| World average certification cost (for 3 ha) | $53010) (Saunders, 2018) |
-
(1) World Price = Average price of Arabica and Robusta coffee (World Bank, 2017) + 20% of premium
-
(2) Subsidy = World average certification cost for 3 ha ÷ 3 × Subsidy % ÷ Yield in kg per ha12)
Based on these figures, welfare change is quantified. According to the theory above, CS change is 0. And the government expenditure is new quantity (Qs’) multiplied by subsidy per unit (kg). PS is supply quantity change (△Q) times subsidy. Table 2 shows the results including supply functions, change of PS and GS (△PS, △GS), total welfare change (△CS+△PS+△GS=△TS) of each scenario. The results suggest that the smaller the subsidy (per kg) is, the smaller the changes of quantity, PS, GS, and TS are, and this subsidy will make total welfare loss in any scenario.
Source: own illustration <Appendix Figure 2>.
V. DISCUSSION
The quantification results show that all of the three scenarios make total welfare loss, yet they are made at different degrees by differentiating the percentage of subsidy. This means that the government can design the subsidy according to their target, goal and budget of this policy. For instance, if they want to maximize the increase of PS regardless of the government expenditure size, they can increase the subsidy. This section discusses some limitations in the quantification, other factors which may influence the welfare change and also external effects generated from organic agriculture.
In the quantification, there are a few assumptions due to the insufficient data and complexity. First of all, in the reality, certification costs are including a certain amount of fixed costs such as application fee and inspectors’ travel costs, so subsidy cannot be calibrated simply through dividing the costs by the yield. Also supply elasticity 0.2 is for general coffee supply elasticity in sub-Saharan Africa and each data here was collected at different times. These aspects might distort the results to an extent. Secondly, only one type of certification which is individual certification was considered, but there are other well-used types. For example, SGC system will reduce expenditures of both sides, the governments and producers. This system can be a strategy of the government to reduce costs in practice. Also, only the short run impact was analyzed. As described earlier, subsidy period can be adjusted by the government. Assuming they set a limit on period, in the long run, there’ll be a big change in welfare after the period, since the government expenditure wouldn’t have to provide the subsidy anymore for this supply. Last but not least, this analysis only considered economic welfare change and this is the biggest reason why it couldn’t make a welfare gain. Next section will describe this aspect.
This paper has only analyzed direct economic impact of certification subsidy on organic and conventional market. However, the government intending to develop organic agriculture sector by subsidy, is likely to consider the non-monetary value of external costs and benefits of organic farming as long as they concern social welfare.
Organic agriculture is known to be a way to make soil healthy and sustainable ultimately in order to prepare for food security in the long run which is one of the globally critical and urgent issues. This is the main reason for lots of countries to develop organic agriculture sector using the policies, even though it makes total welfare loss in terms of private economics. Thus, including the estimated values of environmental benefits would change the analysis results. To be specific, organic farming increases external benefits by reducing external costs of conventional farming for e.g., its water pollution or greenhouse gas emission. These external effects motivate the government which is caring about social benefits to provide subsidy in spite of total economic welfare loss.
However, there are also skeptics who have doubts about the positive environmental effects or insist that those are not likely to be clear. In a prevalent view, organic agriculture achieves relatively low productivity, which means it is inefficient compared to conventional farming. With this perspective, organic farming would need to take more time and land in order to produce the same amount as conventional method does. In case of land scarcity or lack of finance, they would have to cultivate more often without a fallow. Furthermore, since most of Uganda organic products are heading for international market, increased organic products would lead to more exports. Exports require more international transport, mostly by shipping to deliver products, and this increased shipping will create significant amount of GHG emission.13) With this negative impact to environment, environmental benefits of organic agriculture can be offset to an extent.
These conflicting external effects make it complicated and less obvious to evaluate the environmental impact of increased organic produce. Monetizing and comparing these external costs and benefits will be an option for the further research to expand and deepen this analysis.
In reality, there are more factors which can affect welfare change in practice and should be taken into account by the government when designing the policy.
Above all, whether or not non-certified farmers join to the organic market depends on their financial status first. Again, the farming system from most of non-certified organic farmers in Uganda is organic “by default” as they can barely afford synthetic inputs (IFOAM, 2013). These farmers might not even have the rest of costs, then 50% or 70% subsidy would not work for them since they need 100% subsidy. Also, their personal willingness to proceed certification program or to export products is important to make a decision. People always take into account opportunity costs before making decision, so if a change under consideration does not look feasible, they wouldn’t go for it. The certifying processes take lots of efforts and time, thus some of them may just give up and choose to stay in their current position. This is applied to conventional farmers as well and may work even more for them, since conversion to organic farming is not to be done overnight, yet should be accompanied by loads of change or requirements e.g., sales channel, fertilizer disposal. And farmers are generally reluctant to take on new practices when they do not result in immediate financial benefits (Meyer, 2013). Some of them worrying about their livelihood would be hesitant to wait getting the profits from conversion. These farmers would rather concentrate on their current method. Additionally, farmers’ willingness to stay also in the longer term is important for the impact in the long-term view assuming there is the limit of period. If they find that it would not be more profitable after the subsidy period or they cannot be grown enough to stay in the organic market within the given period limit, they may leave or go back to conventional market in the end. This cannot satisfy the government expectations on long-term effects.
The impact size is changeable depending on the selected certificates. There are various organic certification bodies including local and international ones, and each certification of diverse agencies charges the costs dissimilarly and generates different premium price so that farmers have own preferences to choose certification agency. To give an instance, the highest premium in the coffee market is made by the Fair Trade certification (Tumushabe et al., 2007). Hence, total subsidy and income increase can be changed according to the market share of certification agencies.
Global demand change over time also shouldn’t be overlooked, since it directly affects to world price. Global demand for organic products has steadily increased14) and been expected to continue to grow particularly in the developed world such as Western Europe, North America, Japan and Australia and it is estimated to be growing at 20 percent per annum (René & Els, 2004). Demand growth will make an upward shift of ED curve on the graph of <Figure 2> and world price increase from this change will make more profits for producers which represented as PS, then farmers would be more encouraged to enter the organic market. On the contrary, CS will be reduced, if there is no change on domestic demand.
Besides these factors, there are more factors which can influence the impact such as the size of new comers’ lands or own productivity and the type of commodity which has different size of the market and premium price. In terms of the land size, maximum amount of subsidy has not been concerned here since most of farmers in Uganda are smallholders so that the certification costs would not be that much. Nonetheless, there exist several large farm holders who would better be separately recognized for more precise analysis.
VI. CONCLUSION
The aim of this paper was to analyze the impact of certification subsidy policy on welfare of consumers, producers in the Ugandan organic market and the Ugandan government. The result indicates that although each scenario makes different PS and GS change, the direction matches which is total welfare loss. Despite the fact that the subsidy makes total welfare loss, the results indicate clearly that it would make PS increase in the domestic organic market.
For that reason, it is evident that this is an effective policy to secure and improve farmers’ benefits by enhancing their market accessibility and increasing income and to generate more interests in organic farming of non-organic farmers. Not only that, they can expect positive environmental effects as well. Measuring values of external effects and evaluating on environmental effect of organic agriculture have been engaged in a fierce battle, but as of now, organic agriculture is suggested as a globally preferable option as long as there is no alternative to fulfill the level of emission and environmental state desired for organic farming.
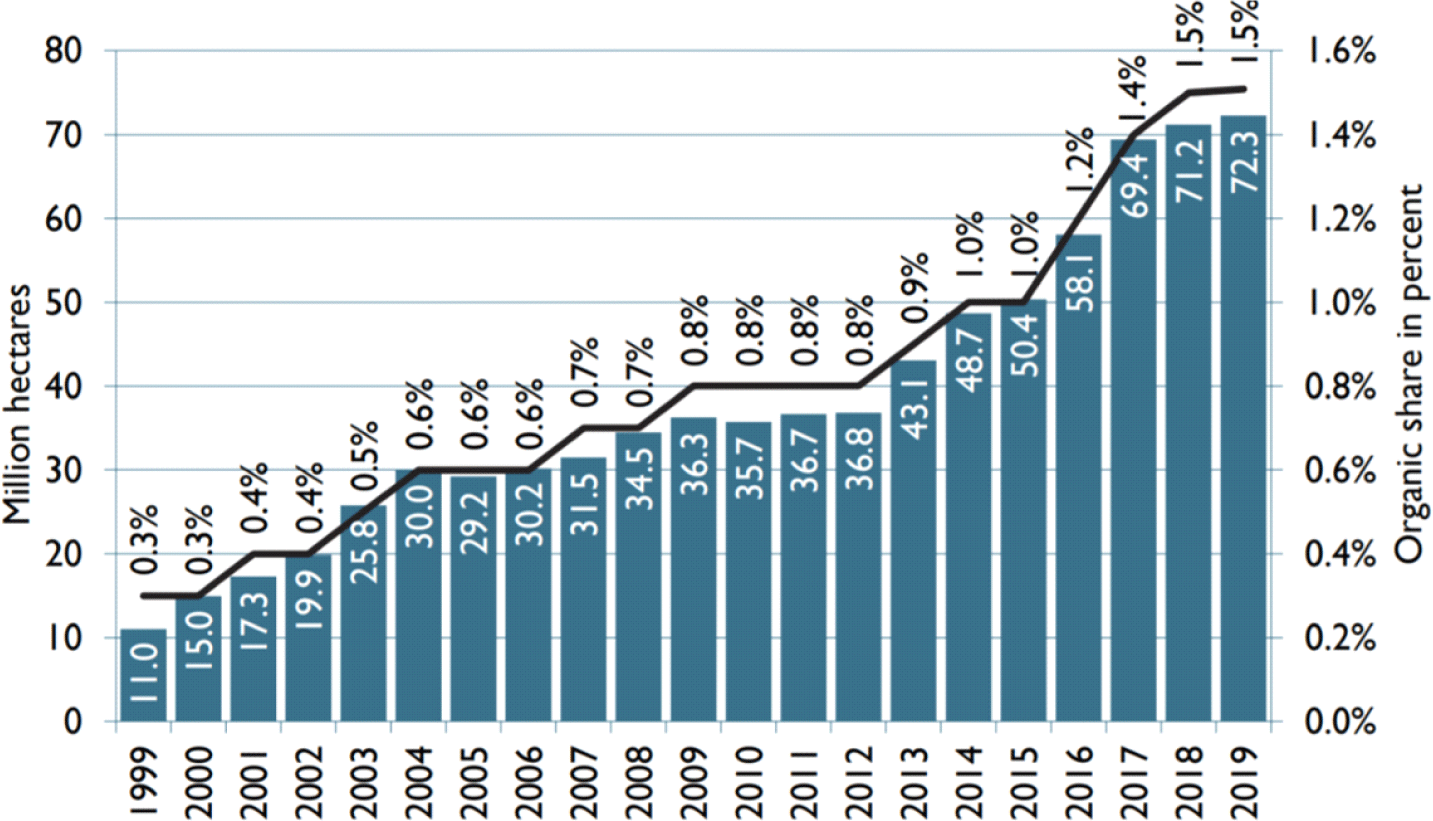
The organic agriculture around the world is growing rapidly creating and expanding new opportunities for farmers, traders and the environment (in <Appendix Figure 2>). Yet, in order to take advantage of these opportunities, pragmatic and systematic policies and regulations will be required with sufficient support. Before or while the government designs the detailed policy, there are some aspects that they precede to or can consider.
Above all things, they absolutely have to conduct field research in order to collect sounder baseline data about current domestic situation or trends of organic farming, especially about non-certified farmers which may be the main target of this policy. So far, little investigations of them have been conducted either officially or privately. The lack of general agriculture data and later on organic agriculture data makes the preparation process complex and generates not completely reliable results. Therefore, baseline studies should be a high priority before support policy implements. More precise data preferably including farm size, yield, income, market relations, and finance status would for sure guide policy-makers to design the policy by estimating expected effects (Rietberg, 2016). As an examples, they can select the scope as well such as commodity, farm size and the region to be covered, if they would like to start from experimental implementation. It can be flexible according to the main target and the state capacity like budget and it should be based on more reliable statistics.
As explained before, the Ugandan organic products are export-oriented since domestic market is too small, that is they are largely relying on the international market. High dependence on exports is very risky, because this makes the market potentially more vulnerable to shocks in the world economy (UNDP, 2011). Hence, it is required to enhance domestic market by increasing domestic demand. In general, factors that affect demand for organic products in the long run are income growth, relative prices, environmental consciousness and exogenous shocks e.g., food scares (Tumushabe et al., 2007). From the government side, it can be achieved by e.g., enhancing consumer awareness of organic product benefits or VAT reduction.
Along with this subsidy provision, there should be subsequent support for new comers by other policy strategies in order to prevent their outflow right after subsidy period. It can be by following the objectives in the organic agriculture policy framework (See <Appendix Figure 3>), for example, supporting research and development or providing training of enhanced technologies.
As the most realistic solution for adopting various suggestions above, the decision makers would be able to deploy development cooperation partnerships. Considering lack of human and material resources of the government, they can cooperate with countries who have sufficient experiences and capabilities to support the government to enhance organic agriculture including both producers and consumers. These cooperation programs may consist of such as collecting and analyzing baseline data, introducing new value chain to boost domestic market and encouraging R&D with relevant training programs.


